[IT Note] Splunk: Infra monitoring tool for Engineer
I've worked in global e-ommerce using AWS and Akami CDN (Content Delivery Network), but a stable monitoring tool for complex networks is needed. Because the nature of Internet service is to operate 24 hours a day, seven days a week, and its maintenance and operation is implemented or updated in a relatively short period of time with a high risk.
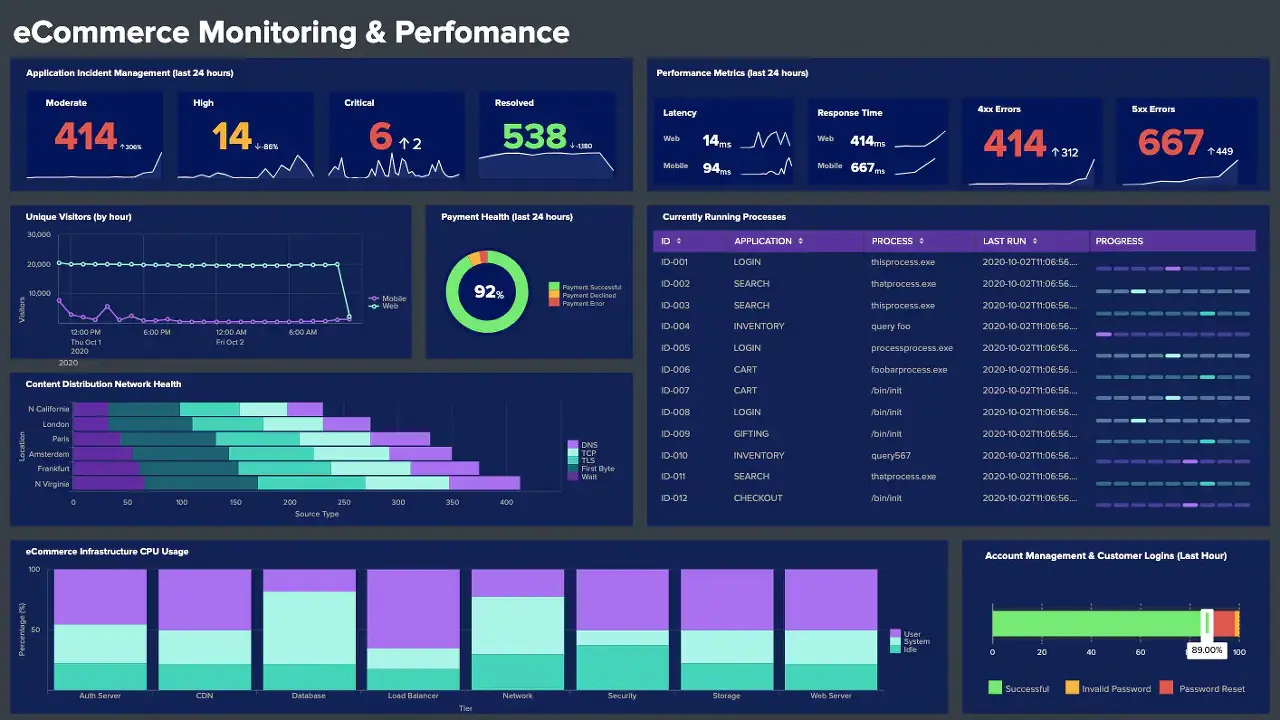
The Splunk tool is popular among engineers because it identifies the root cause of a problem in cloud-based services, eCommerce, content delivery, and so on.

Splunk is a popular tool for monitoring complex networks and identifying root causes of issues. It provides real-time visibility into all aspects of an IT infrastructure, including applications, servers, networks, and security.
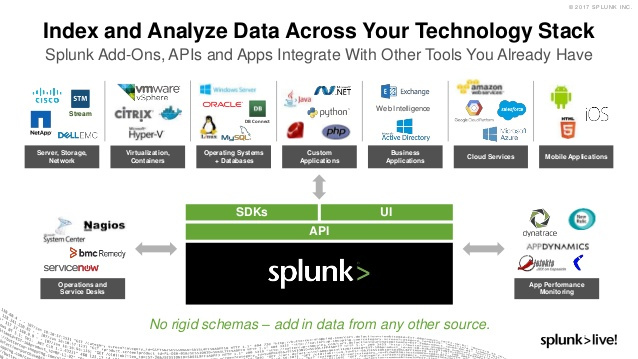
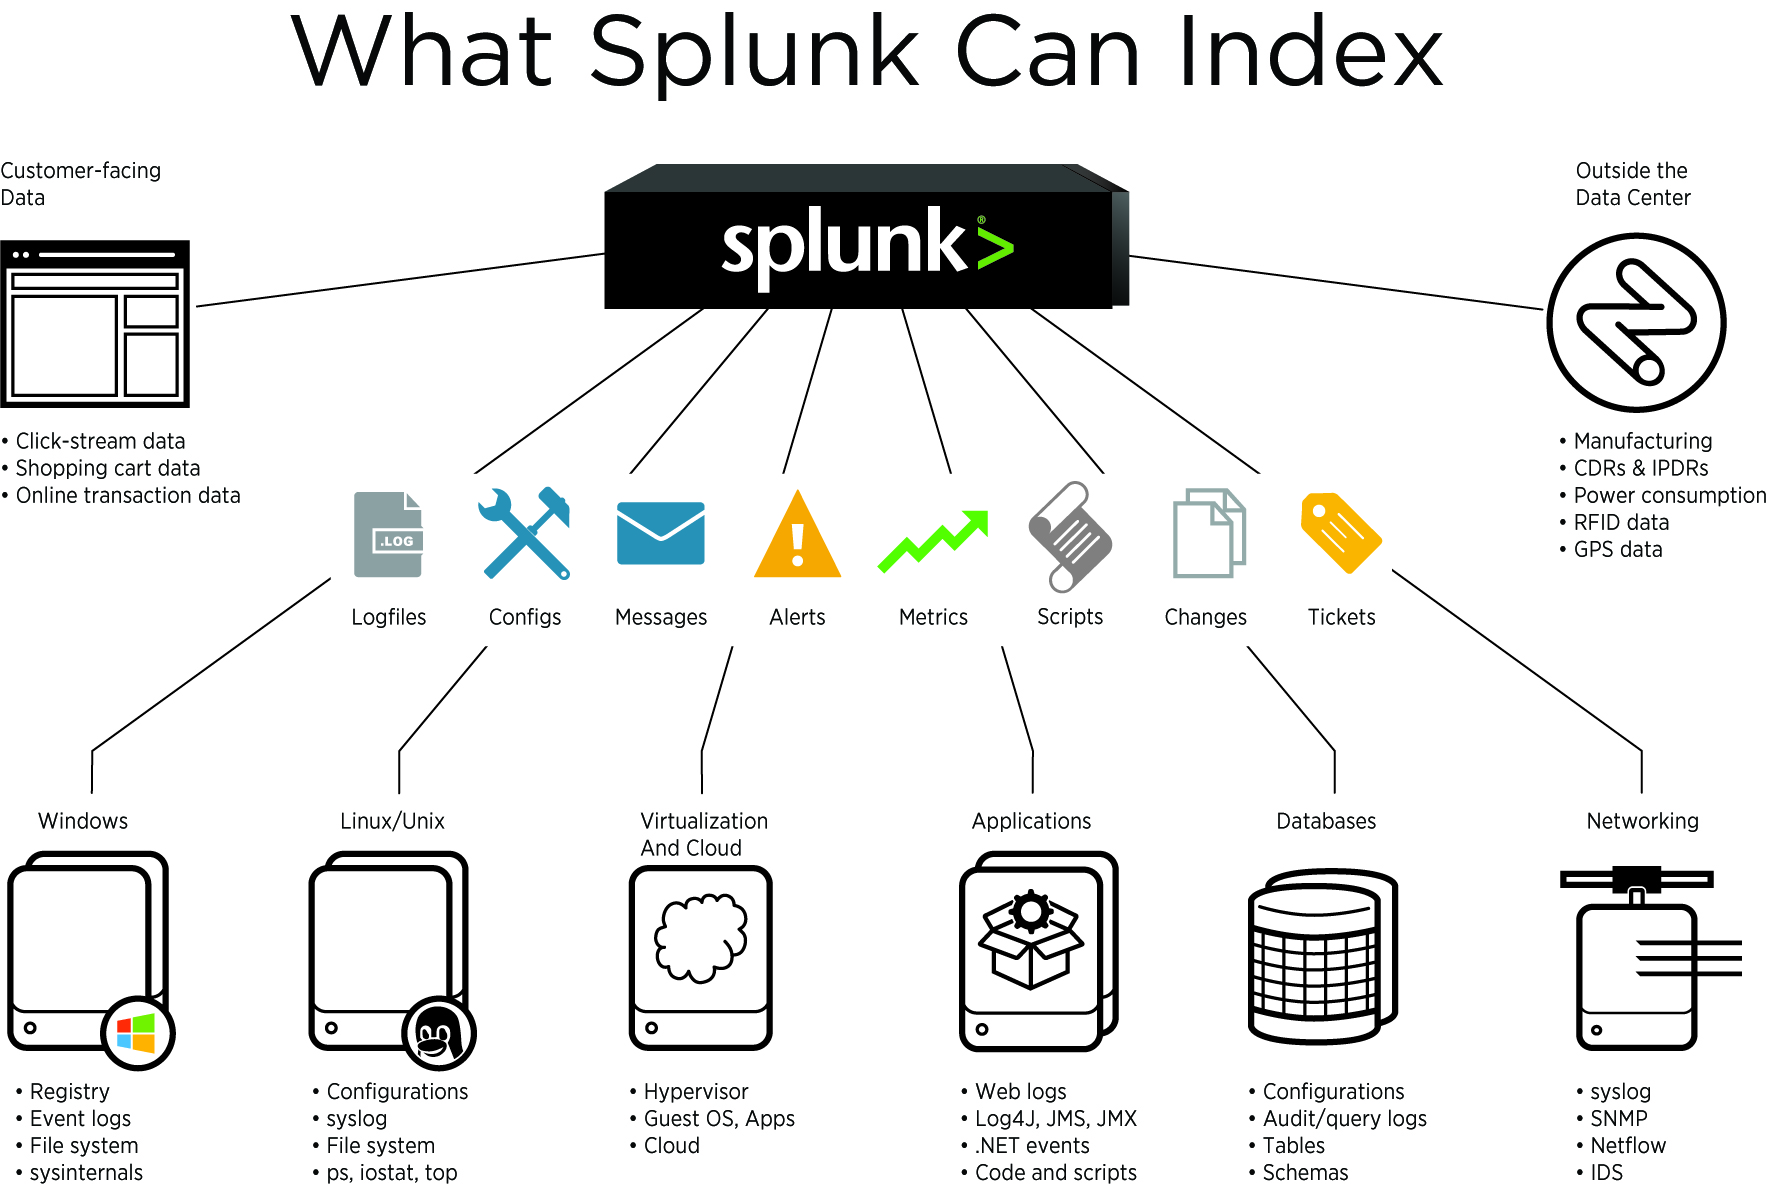
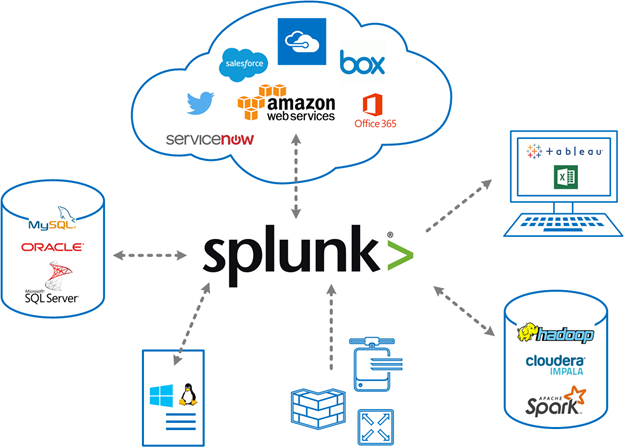
Splunk can collect and analyze data from various sources, including logs, metrics, and events, to gain insights into network's performance and health. It offers a user-friendly interface that allows us to easily search, analyze, and visualize data, making it easier to identify and troubleshoot issues.
Splunk also offers a wide range of features and add-ons, including integrations with AWS and Akamai CDN, which can help you monitor and optimize your cloud-based services. Additionally, it has a robust alerting system that can notify you when issues arise, allowing you to proactively address them before they become critical.

Overall, Splunk is a powerful tool that can help monitor and maintain complex network infrastructure, allowing us to ensure that your services are running smoothly and effectively.
Splunk is almost perfect real-time network monitoring tool to meet the above critical need. It can cover not only monitoring but also network security & traffic. Also Splunk is really powerful to figure out which network point or location make any problems.
A Splunk index can be defined as follows:
"A Splunk index is a repository for Splunk data."
Data that has not been previously added to Splunk is referred to as raw data. When the data is added to Splunk, it indexes the data (uses the data to update its indexes), creating event data. Individual units of this data are called events. In addition to events, Splunk also stores information related to Splunk's structure and processing (all this stuff is not event data), transforming the data into its searchable events.

Frankly speaking, I've confused all mixed up tools as the belows at first time, becasue they can show some levels of active visitor, hit number or visit number from their dashboards or admin tools. Even many engineers and marketers are different understanding about these tools and outputs.
#1. Web Analytics : Adobe Analytics or Google Analytics
#2. Traffic Performance APM : Dynatrace
#3. Infrastructure/Application Monitoring : Splunk
#4. Network Traffic : AWS/Azure cloud or Akamai/AWS CDN
#5. eCommerce Engine : SAP Hybris
#6. BI Tools : MS Power BI
#7. Data Visualization : Tableau
The #1. web analytics is more focused front-end user behaviors, and #2. traffic performance is to cover overall traffic volume with visualization, and #3. infra/application monitoring is to show actual network status and problematic points, and #4. newtork traffic is measured back-end status from their cloud or CDN data volume.
I got the technical explanation from Splunk engineer last time, and I realized that Splunk can cover all others, #1-#4, even different level of monitoring.

Eventually, Splunk is critical tool to network engineers not for project leader or business manager, but it needs to be learned what features of Splunk can do that and how Splunk can give the dashboard or network points to engineer.
'경영 지식 > 시사 지식' 카테고리의 다른 글
| [Biz] balance sheet vs cash flow statement (0) | 2022.10.22 |
|---|---|
| [Biz] lifo vs fifo (1) | 2022.10.22 |
| [Biz] Accounting principle (1) | 2022.10.22 |
| [IT Note] Dynatrace, Top Cloud Monitoring (0) | 2022.10.21 |
| [IT Note] Amazon: e-commerce Top1 in US (0) | 2022.10.20 |